A dashboard for my first grow
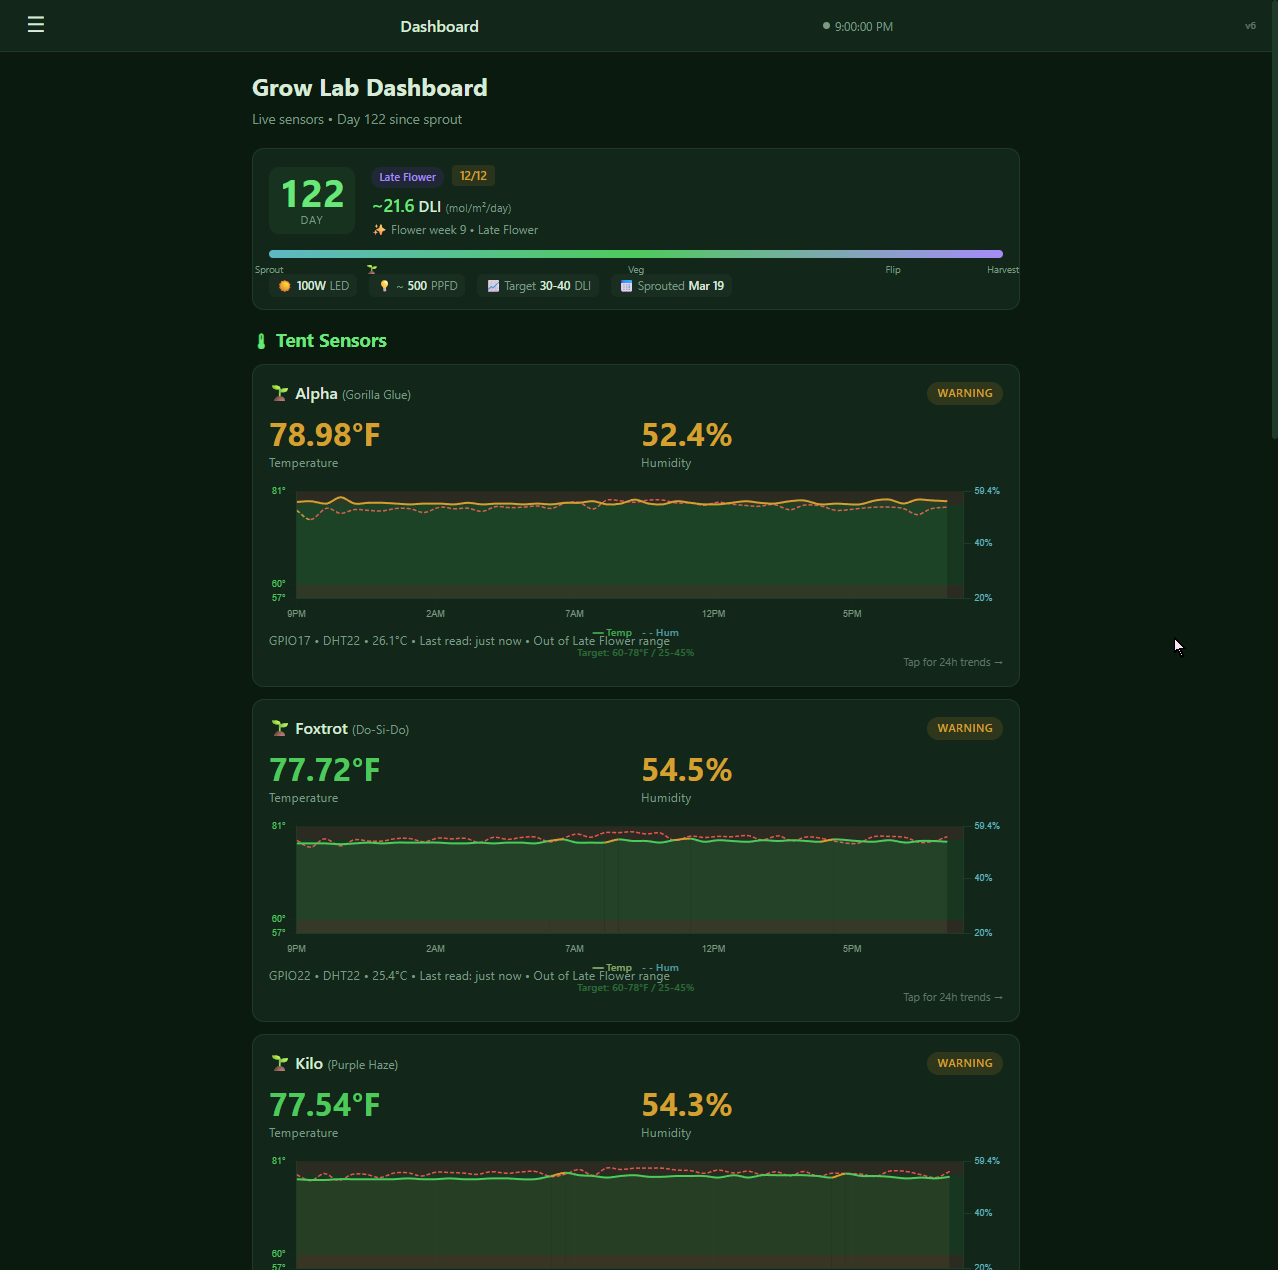
My first time growing a plant, so — naturally — I built it a self-hosted Raspberry Pi dashboard: sensors, VPD, a daily journal with AI photo analysis. The Pi's coming down, so I froze the whole thing into a browsable demo.
I grew a plant. My first one ever, seed to harvest — and being me, I couldn't just grow it. I built it a dashboard.
The plant is done now, and the Raspberry Pi that spent four months watching over it is about to be unplugged. So before it all vanishes, I froze the whole thing into a browsable demo. Every number, chart, journal entry and photo is a snapshot from the final day of the grow, and you can click through the entire thing at Grow Lab.
Why a first-timer builds a dashboard
The honest version: I had no idea what I was doing. It was a legal, adult-use personal grow — three plants' worth of "how hard can it be" — and the answer, it turns out, is that there are a lot of little numbers that all matter at once. Temperature, humidity, the gap between the two (that's VPD), hours of light, how far the light sits from the canopy, when to feed, when to stop. Miss the range for your growth stage and the plant tells you — slowly, a week later.
I didn't want a shoebox of sticky notes. I wanted one screen that told me whether things were okay right now, and a place to write down what I did so that future-me could work out what past-me broke. So this was never really a monitoring project. It was a personal guide — a way to learn the craft by instrumenting it.
What it actually does
The hardware is unglamorous: a Raspberry Pi in the corner of the tent, three DHT22 temperature/humidity sensors on the plants (I named them Alpha, Foxtrot and Kilo), and a couple of Bluetooth probes for the tent and the outdoors. The Pi reads them every few minutes and a little Node app turns that into the screen above.
- Live sensor cards with 24-hour sparklines, colour-coded against the target range for the current stage — green when I'm fine, amber when I'm drifting.
- A VPD gauge, because "temperature and humidity are both fine" and "the plant is comfortable" are not the same sentence.
- Stage-aware alerts that know a seedling and a late-flower plant want completely different conditions, and ping me on Telegram when something's out of band.
- A day counter tracking where I am in the grow — the screenshot is Day 122, deep into flower.
The part that made it a guide
The sensors were the easy half. The half that actually taught me anything was the journal.
Every day I'd write down what I saw and what I did — watered, defoliated, panicked about a droopy leaf — and attach photos. Those photos went to Claude, which I'd wired in as an on-call grow assistant. It would look at a picture and tell me what it saw: real deficiency or just a hungry old fan leaf, light stress or normal stretch, ready to chop or give it another week. When I was really unsure, I could open the expert chat and just ask.
A dashboard tells you a number is wrong. A good guide tells you whether the number is wrong enough to do something about it — and what to do.
And because I kept hitting the same questions, I ended up writing them down as little education pages — plant anatomy, what VPD actually is, how to prep for the 12/12 "flip," and, right at the end, flushing and harvest: reading the trichomes, drying slow, curing in jars. It quietly became the guide I wish I'd had on day one.
It's a snapshot now, on purpose
The demo is deliberately frozen. There are no live sensors behind it anymore — the Pi's coming down — so everything you see is captured from the last day: the clock is stopped at Day 122, the AI replies are canned examples, and anything that would normally save data is switched off. It looks alive; it just isn't. That's the point. It's a museum piece of one first grow, not a running system.
Poke around anyway: the dashboard, the day-by-day journal with the real photos, the timelapse, the education pages. If you've ever thought about growing something — anything — and wondered whether you'd know what you were looking at, this is roughly the training wheels I built for myself.
Would I do it again
The plant survived my learning curve, which is the main thing. But the honest takeaway is that the dashboard didn't grow the plant — it made me pay attention, every single day, and write down what I noticed. That's the actual skill. The Raspberry Pi just made it harder to look away.
Three plants, four months, a wall of tiny numbers, and a guide I built as I went. Not a bad first grow. Have a look at Grow Lab.
Comments