Watching chips talk
Chips talk to each other over tiny wires, millions of times a second, and you cannot see any of it. So I spent an afternoon turning a five-dollar microcontroller into an instrument that can — and found out my I2C bus runs at less than half the speed it claims.
Every electronic device you own is full of chips having conversations. Your thermostat asks a sensor how warm it is. Your phone asks its battery how full it is. These conversations happen over tiny wires, millions of times a second, by flicking voltage on and off in patterns.
You cannot see any of it. That is the problem. When two chips stop getting along, you are debugging a silent argument between things that cannot tell you what went wrong.
So I spent an afternoon building a machine that can hear them.
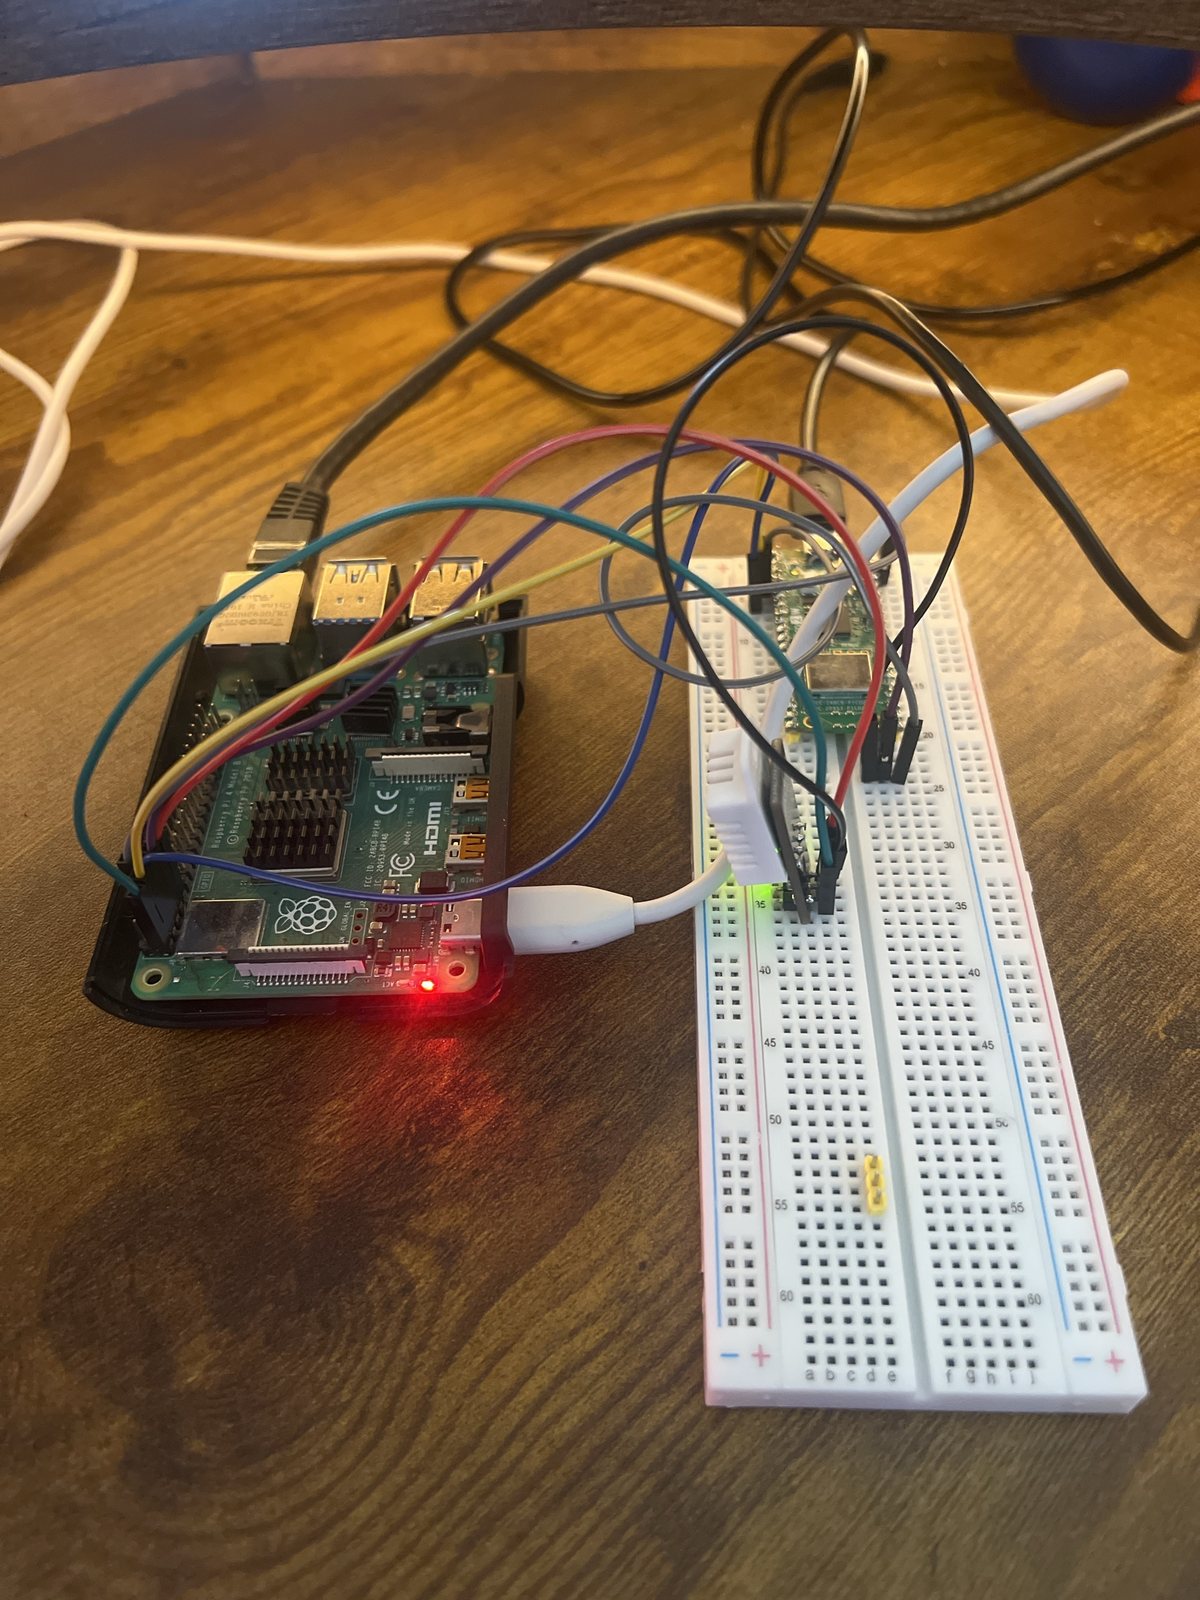
A camera for wires
The tool is called a logic analyzer. The name sounds intimidating; the idea is simple. It is a camera that points at wires instead of at people. It does not record pictures — it records one question, over and over: is this wire on, or off?
Mine asks that question 100 million times per second, on up to 21 wires at once. Play the answers back in order and the invisible conversation turns into something you can read.
The whole thing is a Raspberry Pi Pico 2 — a microcontroller that costs about five dollars. It is not special hardware. Someone wrote firmware that turns an ordinary one into a measuring instrument, and you load it on like installing an app. That is the part I still find slightly absurd.
The thing it is not
I have to clear this up, because I got it wrong myself at first and it matters.
A logic analyzer only sees on or off. Digital. It is very good at watching many wires at once and telling you exactly when each one flipped.
An oscilloscope is the other tool. It sees the actual shape of the voltage — the wobbles, the ramps, the noise, everything between on and off. Real electricity is not a clean staircase. It overshoots, it rings, it sags. A logic analyzer politely rounds all of that off and tells you "on." An oscilloscope shows you the mess.
Digital asks when. Analog asks what shape. You need both, and they are genuinely different instruments.
Building the digital one is mostly software. Building the analog one is mostly careful electronics — amplifiers, filters, protection circuits, the stuff that keeps a 3.3-volt chip from being destroyed by whatever you clip it onto. That is the sister project, and it is the reason I did this one first. I now understand the thing I am about to build the harder version of.
Listening to a thermometer
My first real target was a cheap temperature and humidity sensor called a DHT22. It talks over a single wire, and it talks in something very close to Morse code.
The sensor blinks. A short blink means zero. A long blink means one. Forty blinks in a row spell out the temperature and the humidity. That is the entire language.
Here is what the analyzer measured, and it is the part I did not expect to find satisfying:
- A "zero" blink lasts about 25.6 microseconds.
- A "one" blink lasts about 69.2 microseconds.
- Nothing whatsoever happens in the 42 microseconds between them.
A microsecond is a millionth of a second. That empty 42-microsecond gap is why the sensor is reliable — a zero is never even close to being mistaken for a one. I had read that this sensor was "finicky." Now I can see that it is not; it is precise, and the gap proves it.
I also caught it failing. Out of 87 readings, 85 came back perfect and two came back garbled. That is 98%, not 100%, and the 2% is real — a reading that arrived scrambled and got thrown away. Before today I would have had no way to know whether the sensor or the computer was at fault.
Putting it on a screen
Numbers in a terminal get old fast, so the measurements now feed a live dashboard. The Windows machine does the capturing, packages the results into a file, and ships it to the Raspberry Pi, which serves it as a small web page that refreshes itself every five seconds.
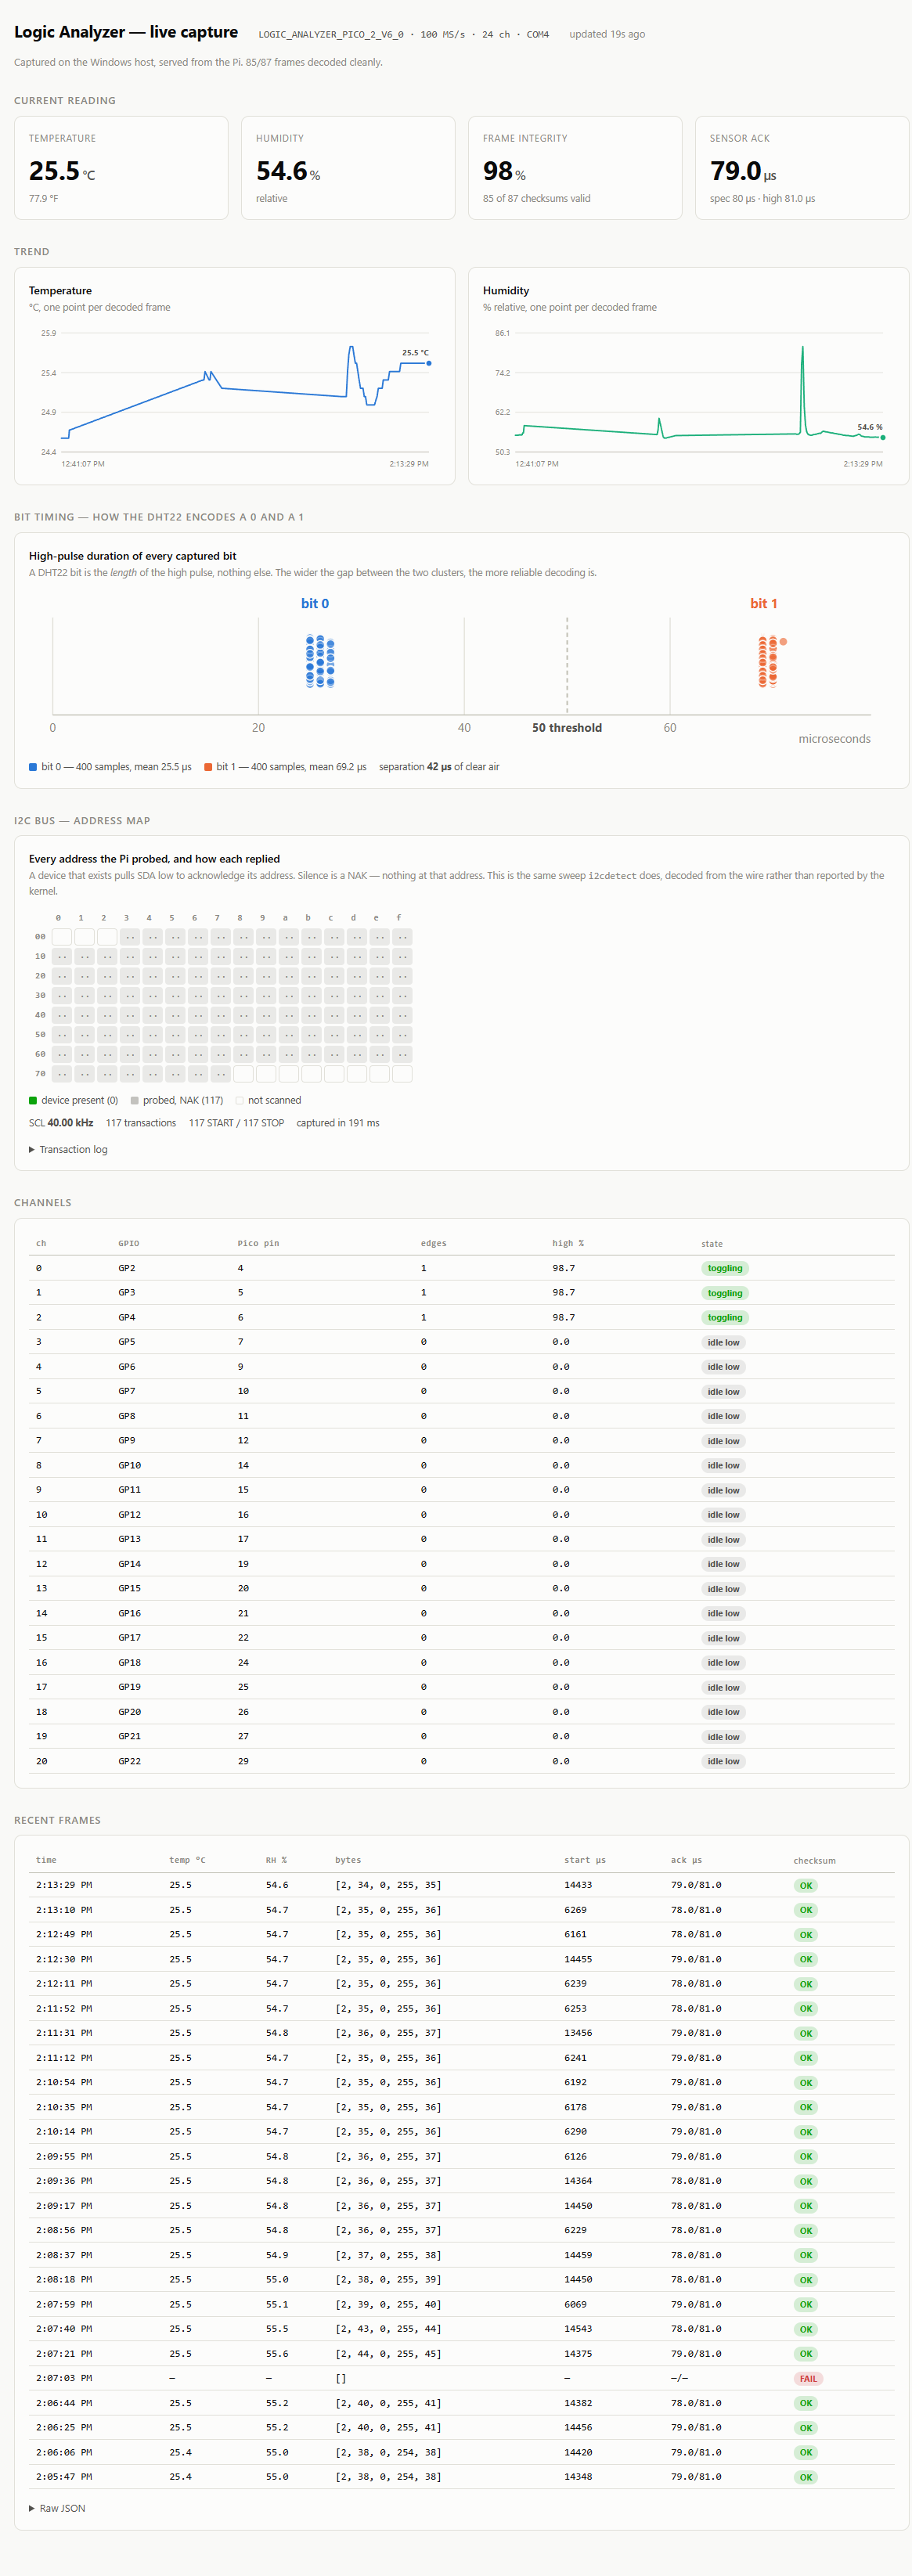
The chart in the middle is my favorite thing here. Every dot is one bit the sensor sent. They land in two tight clumps with a canyon between them. That canyon is the reliability. You do not have to trust me that the sensor is good — you can see it.
Eavesdropping on a roll call
The next protocol I listened to is called I2C, and it is how an enormous number of chips talk to each other. It uses two wires. One is a metronome that ticks; the other carries the actual message, read on each tick.
Every device on the line has a name — a number, really, called an address. To find out what is connected, the computer simply calls out every possible name and waits to see who answers. A device that exists yanks the wire down to say here.
I recorded one of these roll calls. All 117 names, called in order, every one met with silence — nothing was connected to that line yet. That sounds like a failure and it is genuinely not: each unanswered call is still a complete, correct conversation, and seeing the skeleton of the protocol without any message cluttering it up is a better first lesson than a chatty sensor would have been.
Then the analyzer told me something I did not ask about. The metronome is supposed to tick at 100,000 times a second. Mine ticks at 40,000. The software requests 100 kHz; the hardware quietly does something else, and nothing anywhere reports this. I had a theory about why, tested it by loading the Pi to make it run faster, and the theory was wrong — the rate did not budge.
I still do not know why. But "I can now see that my assumption was false" is a much better place to stand than "I assumed it was 100 kHz." That is what the instrument is for.
The diagram
Six wires connect all this together. That is not many, and I still got them wrong three separate times, so I drew it properly.
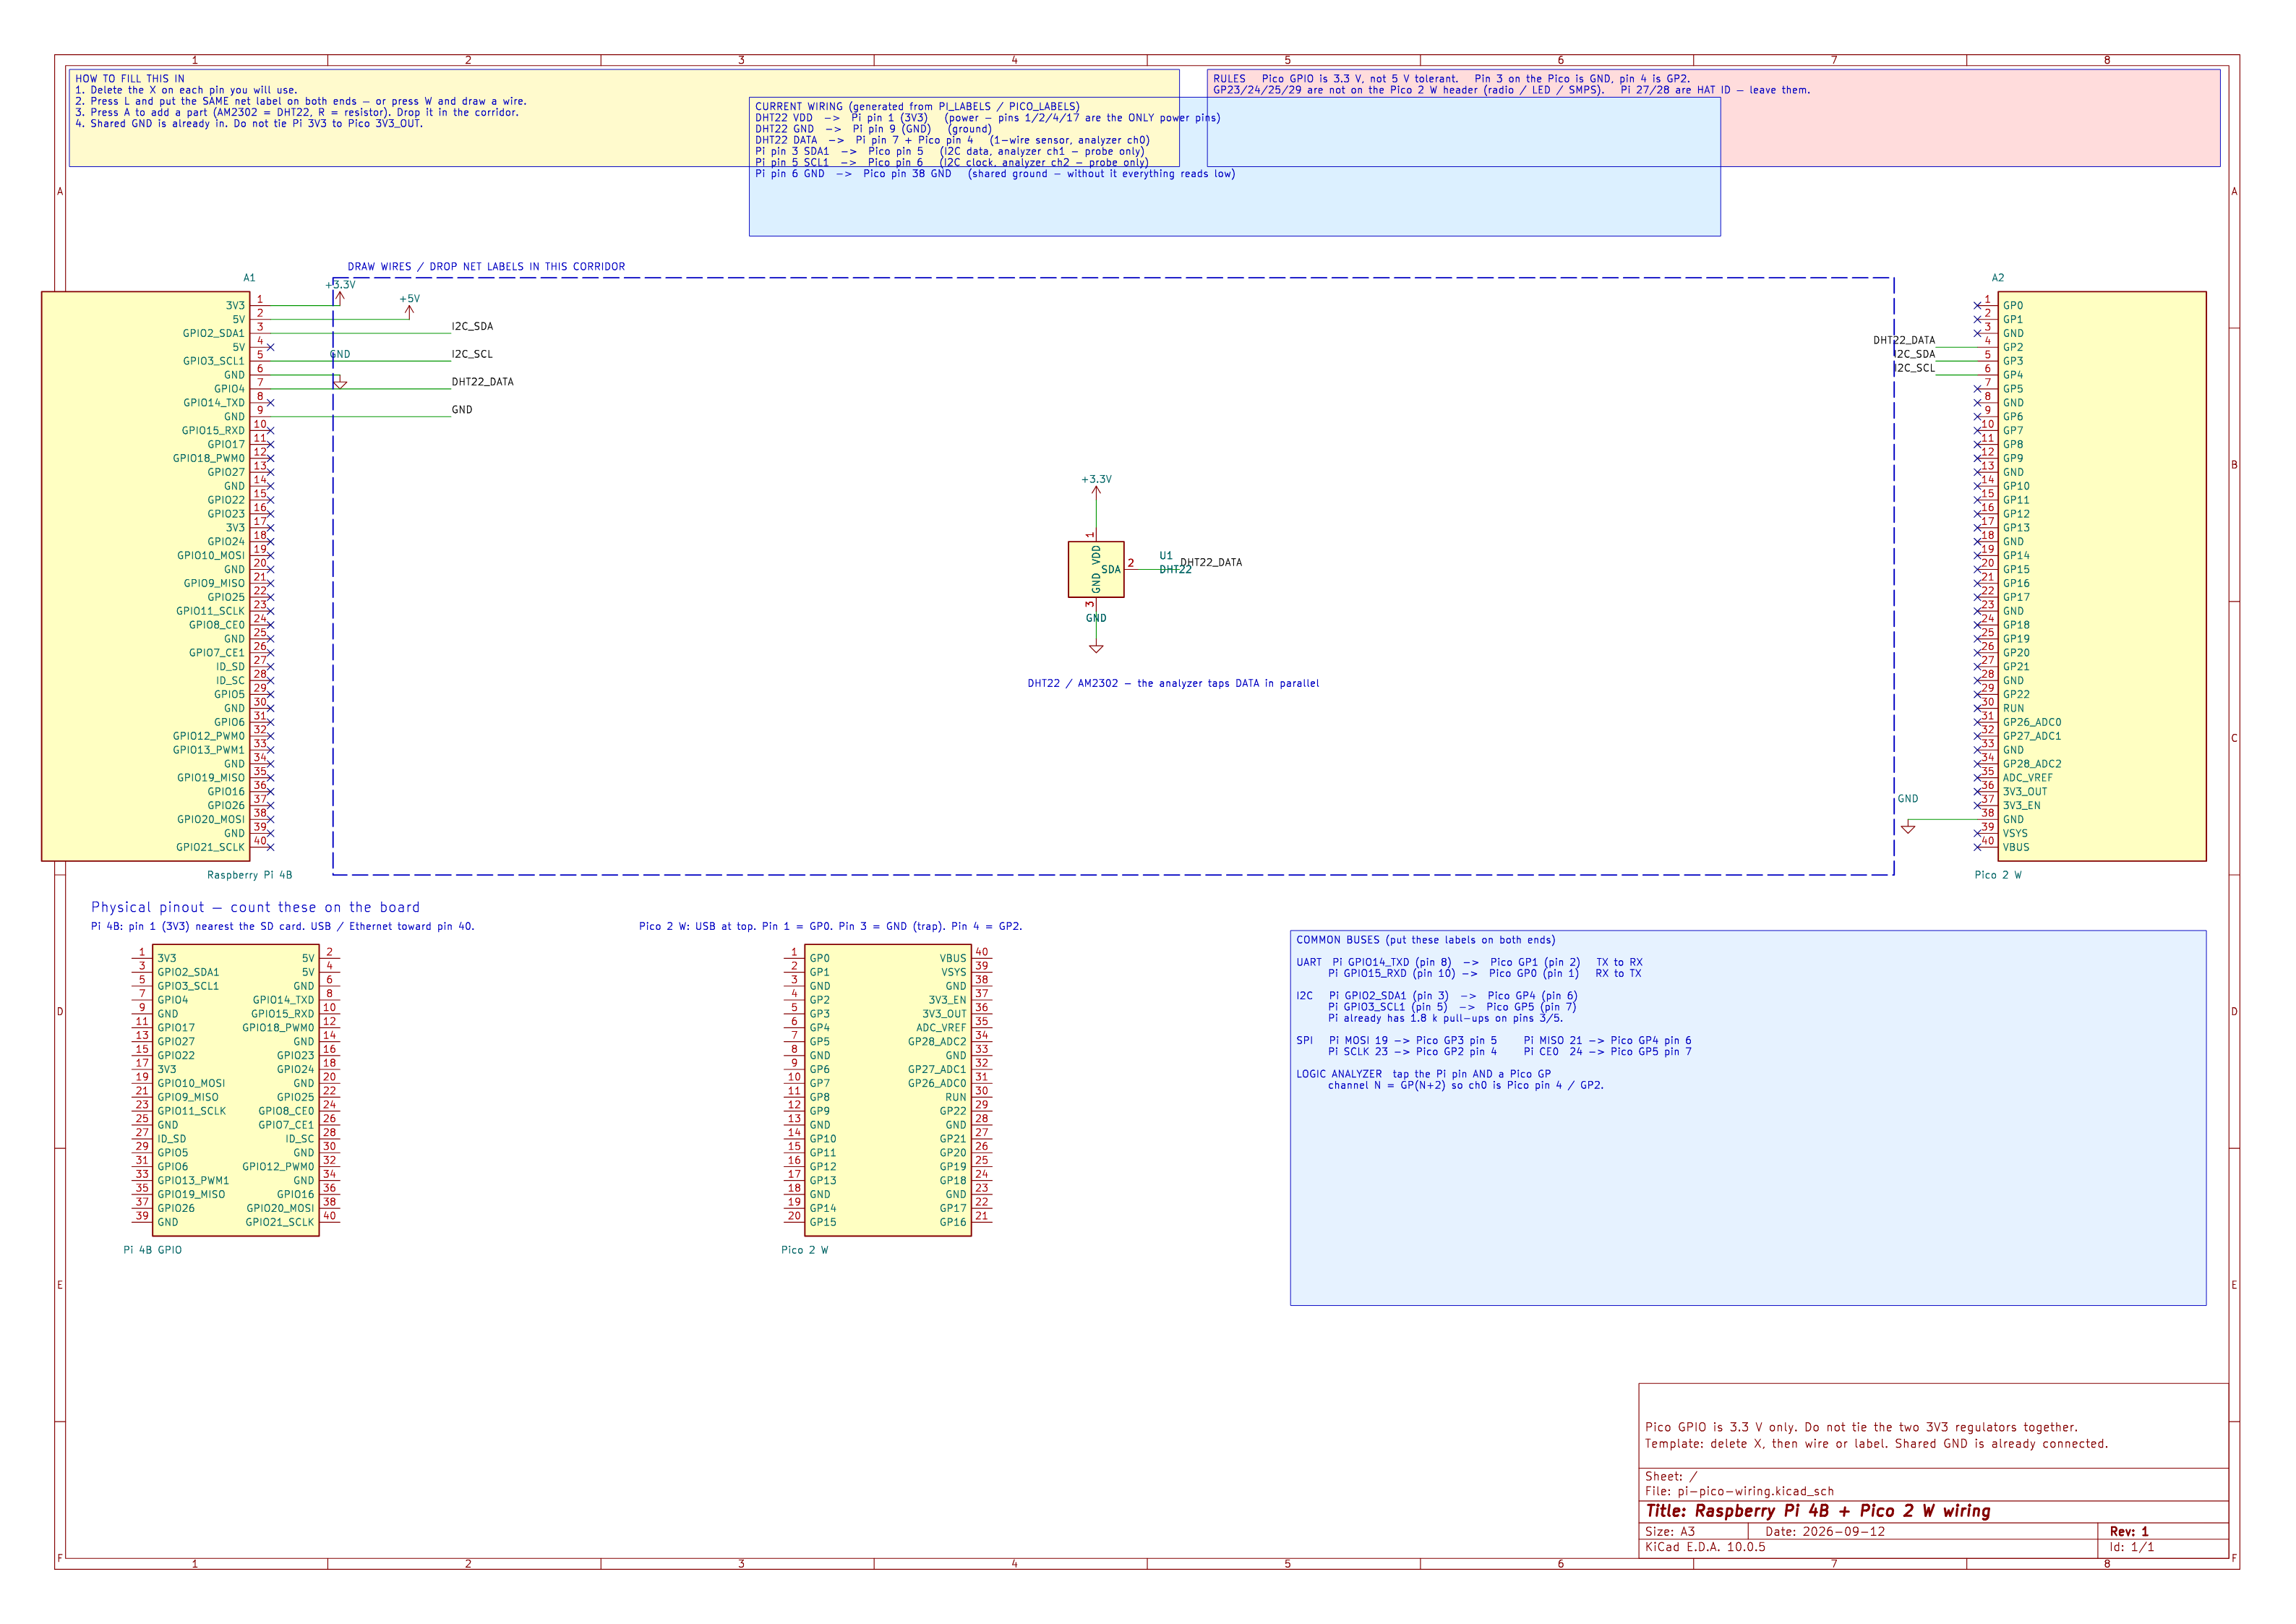
| From | To | What it carries |
|---|---|---|
| DHT22 VDD | Pi pin 1 (3V3) | power — pins 1, 2, 4 and 17 are the only power pins |
| DHT22 GND | Pi pin 9 (GND) | ground |
| DHT22 DATA | Pi pin 7 (GPIO4) | the Pi asks the sensor for a reading |
| DHT22 DATA | Pico pin 4 (ch0) | the analyzer listens in — pin 3 is ground, pin 4 is ch0 |
| Pi pin 3 (SDA) | Pico pin 5 (ch1) | I2C data |
| Pi pin 5 (SCL) | Pico pin 6 (ch2) | I2C clock |
| Pi pin 6 (GND) | Pico pin 38 (GND) | shared ground — without it everything reads flat |
The diagram is generated by a script rather than drawn by hand. I list the connections in one place, run the script, and it produces the schematic, a PDF, the interactive page above, and the wiring table in the project's README. They cannot disagree with each other, because they all come from the same list. This matters more than it sounds like it should — a wiring diagram that has drifted out of date is worse than no diagram at all.
Three ways I broke it
Every failure today looked identical on screen: every wire reading flat, dead, nothing. Three completely different causes produced the exact same symptom.
No shared ground. Voltage is always measured relative to something. Saying you are six feet tall only means anything if we agree where the floor is. Two circuit boards need a wire between them establishing a common floor, or every measurement is nonsense. One missing wire made the whole thing look broken.
Off by one hole. Twice I put a probe in the pin next to the one I meant. On this board, the neighboring pin happens to be ground — so the signal was being shorted straight to the floor. It reads exactly like a broken wire. There is no clever way around this one; you just have to count.
Powering a sensor from the wrong pin. This one is my favorite, because it fails so quietly. On a Raspberry Pi, only four of the forty pins supply power. I moved the sensor's power wire onto a data pin by mistake. In the mode that pin was in, it can only pull voltage down — it physically cannot push power out. So the sensor just went dark. No spark, no smoke, no error. It simply stopped, and the reason was invisible until I measured it.
What it cost, and what is next
A five-dollar chip, free firmware, an afternoon, and some jumper wires I already owned. That is the whole bill of materials for an instrument that can watch a conversation happening a hundred million times a second.
Next up is putting an actual I2C device on that line, so the roll call finally gets an answer and there is a real message to decode instead of a skeleton.
After that: the analog one. The oscilloscope. That build is a different animal — the chip part is easy, and the hard part is the careful electronics that sit between the probe and the chip. But I am going into it having already watched real signals behave in ways I did not predict, which feels like the right order to do these in.
The code
All of it is on GitHub, MIT licensed: deokman420/logic-analyzer.
That is the Python driver, the three decoders, the dashboard, the scripts that run on the Pi, and the script that draws the schematic. The README carries the things that cost me the most time — especially the one where asking the analyzer to wait for something that never happens locks it up until you physically unplug it.
The firmware that turns an ordinary Pico into an instrument is not mine. That is gusmanb/logicanalyzer, and it deserves the credit.
Comments